Stretch Precision and Repeatability
The testing repeatability is a critical requirement applicable to the fabric stretch testing. Achieving the test results repeatability provides you with the reliability of the raw measurement data as well as derived fabric stretch resistance properties which is a necessary to obtain the realistic simulation.
There are following major factors positively affecting the precision and repeatability of stretch testing results.
-
Preserving the relatively high sample rate during the testing (reaching the maximum level of 100 measurements per second) provides you with the ability to build a smooth stress-strain curve accurately describing the fabric behavior. Typically, for stretchable fabrics, the high sample rate provides you with the raw measurement data including 150-200 records of measured force/position pairs. For rigid fabrics, there are 30-40 force/position pairs available.
-
Using a relatively long initial distance (by default equal to 10cm) between clamps provides you with the extended range for the upper clamp position measurement. Such an extended range provides you with more distinct differences between neighbor position measurements causing building smoother and more precise stress-strain curve.
-
Punctual following conditioning guides and test procedure
-
Preserving accuracy in specimen cutting
The diagram below provides you with the measurement results acquired for three different specimens of the same fabric (100% cotton denim). The resulting curves are transformed into Force and Elongations axes.
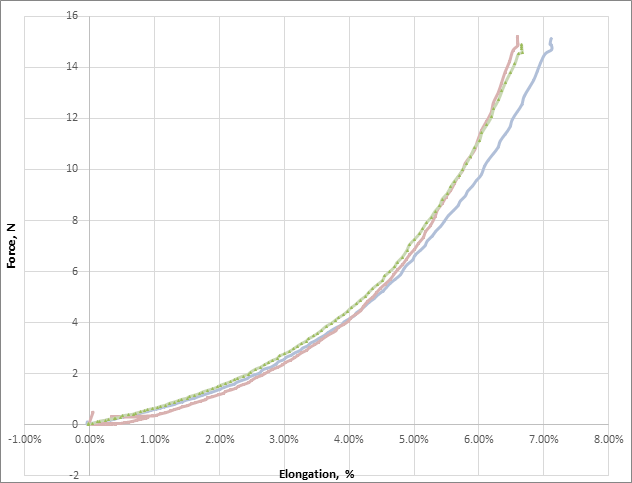
Analyzing curves above, we could state that all three measured specimens provide you with low deviation results especially in the proportional deformations area (up to 1.5N appx.). The table below provides you with the actual extended distance and elongation determined for the same force value of 1N.
| Specimen # | Force, N | Elongation, % | Actual measured distance, cm | Deviation from average % |
|
1 |
1 |
1.54 |
10.154 |
-0.05 |
|
2 |
1 |
1.78 |
10.178 |
0.18 |
|
3 |
1 |
1.5 |
10.15 |
-0.09 |
|
Average |
|
|
10.16 |
|
The table above provides you with the percentage of elongation determined for the same force value for three specimens. For every elongation value, the actual measured extended distance is provided as well. For the current series of measurements, the deviation of the actual measured distance from the average provides you with the precision rate of measurements. The achieved precision of distance measurements is within the range of ±0.2%.
Further determination of the proportional deformation portion of curves and linear approximation of measurement results provides the slope of the linear graph which is considered as the Stretch property (stretch resistance represented by the Young’s modulus). Calculated stretch values are provided in the table below.
| Specimen # | Stretch resistance, grf/cm | Deviation from average, % |
|
1 |
3265 |
-2.29426 |
|
2 |
3431 |
2.673317 |
|
3 |
3329 |
-0.37905 |
|
Average |
3341.667 |
|
In this way, the achieved precision of the calculated stretch resistance values are within the range of ±2.7%. The availability of such a scatter in results is explained by the non-homogeneous structure of fabric and the reason for the difference of tested specimens.
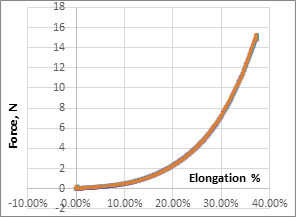
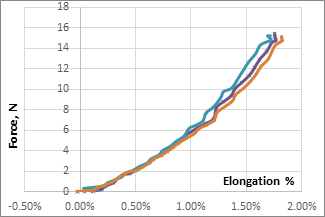
The diagrams below provides the force/elongation curves generated due to the result of measurement of stretchy plain woven and rigid polyester fabrics.
|
Stretchy plain woven fabric (98% Cotton, 2% Lycra) |
Rigid Jacquard Fabric (100% Polyester) |
|
|
|
The table below provides the resulting calculated values of the Stretch property (representing stretch resistance).
| Stretch resistance, grf/cm | Deviation from average, % | Stretch resistance, grf/cm | Deviation from average, % |
|
445 |
0.527108 |
17911 |
1.081681 |
|
446 |
0.753012 |
17781 |
0.348019 |
|
437 |
-1.28012 |
17466 |
-1.4297 |
|
Average: 442.6667 |
|
Average: 17719.33 |
|
Summarizing the data provided in the table above, the achieved precision of the calculated stretch resistance values is observed to be within the range of ±1.5% for both stretchy and rigid fabrics.
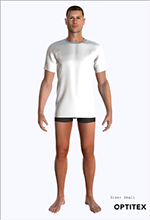
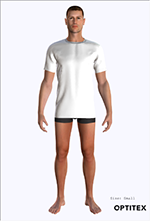
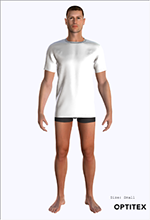
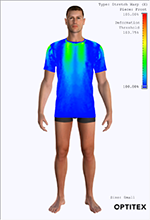
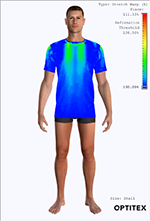
As mentioned above, the precision range of ±2.7% was achieved during tests for the stretch resistance values. Such a value range provides you with the minor difference in the simulation results. The table below illustrates the simulation results for the stretch resistance values measured for the 100% cotton denim fabric.
|
Stretch resistance of 3265 grf/cm |
Stretch resistance of 3431 grf/cm |
Stretch resistance of 3329 grf/cm |
|
|
|
|
|
|
|
|